Sunday, December 21, 2008

How to connect to the internet using Celcom Broadband Modem

Luckily, I got my hand on my friend's Celcom Broadband USB HSDPA Modem. The model is E220. Fortunately on Mandriva, you don't need to type a command. It's all in the comfort of GUI.

below is the step-by-step process:

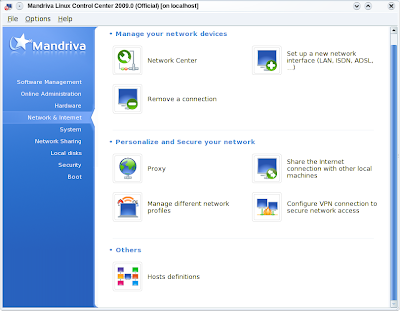
1. Open MCC (Mandriva Control Center) and then select Network & Internet (left frame) and then open Setup a new network interface.

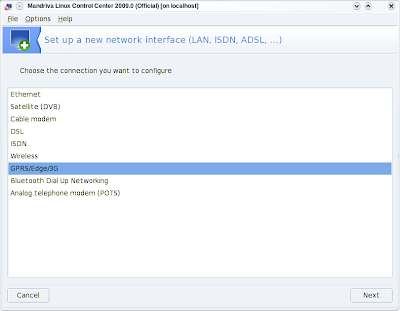
2. Select GPRS/Edge/3G and click Next button.

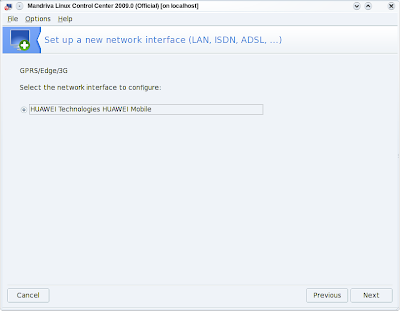
3. The device should be shown and selected here. If not, you have to check whether Linux detected it using lsusb command. In many cases, this shouldn't be a problem for Linux detecting a USB device. Then click the Next button.

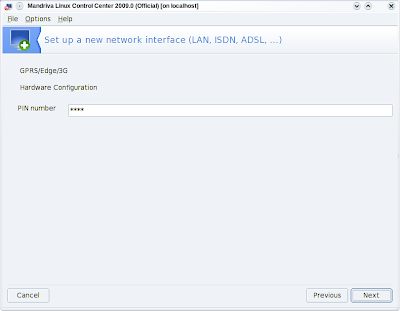
4. It will ask you for PIN number. One problem here. You have to enable PIN Protection for your card by going into MS Windows and use the software provided by TM to enable the PIN Protection. It is disabled by default. If it is disabled, you will get error after this even the PIN number is correct. After enable the PIN Protection, you can boot back into Linux and enter the PIN number as in the pic below. Then click Next.

5. This dialog opens and you can just click Next.
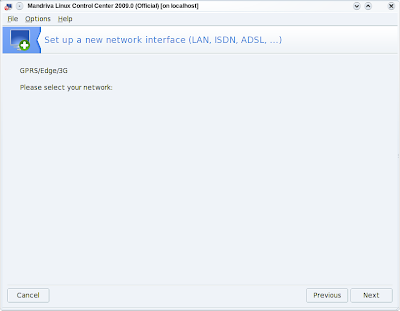

6. Select the option as below and then click Next.
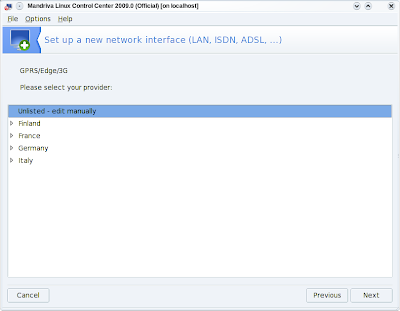

7. For dialog as below, just leave all fields blank. Click Next.
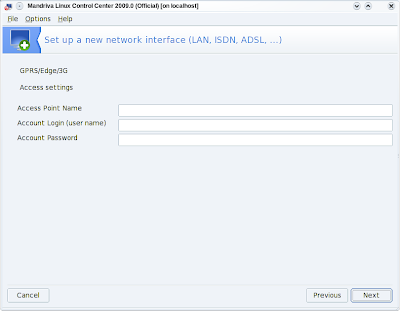

8. Finish. A window will appear telling you that the settings has been configured successfully. Click Finish button to close it.

9. You can see the /var/log/messages on what's been going on and important info like IP address, APN, netmask, gateway and handshakes during the connection process.

Example log:
Dec 21 23:50:42 localhost ifup-ppp: pppd started for ppp0 on /dev/ttyUSB0 at 115200
Dec 21 23:50:42 localhost pppd[2605]: pppd 2.4.4 started by root, uid 0
Dec 21 23:50:49 localhost pppd[2605]: Serial connection established.
Dec 21 23:50:49 localhost pppd[2605]: Using interface ppp0
Dec 21 23:50:49 localhost pppd[2605]: Connect: ppp0 <--> /dev/ttyUSB0
Dec 21 23:50:53 localhost pppd[2605]: Could not determine remote IP address: defaulting to 10.64.64.64
Dec 21 23:50:53 localhost pppd[2605]: local IP address 10.58.182.246
Dec 21 23:50:53 localhost pppd[2605]: remote IP address 10.64.64.64
Dec 21 23:50:53 localhost pppd[2605]: primary DNS address 202. 188.0.133
Dec 21 23:50:53 localhost pppd[2605]: secondary DNS address 202.188.1.5

That's all there is to it. Good luck guys!

Friday, December 12, 2008

Queuegraph - a RRDtool frontend for Postfix queue-statistics

queuegraph is a very simple mail statistics RRDtool frontend for Postfix that produces daily, weekly, monthly and yearly graphs of Postfix's active, deferred, incoming and bounce queues.The postfix's queue is usually in /var/spool/postfix. queuegraph is created by Ralf Hildebrandt and based on mailgraph by David Schweikert. Below is the dirs in my system:

# ls /var/spool/postfix/
active/ corrupt/ deferred/ etc/ flush/ incoming/ maildrop/ postgrey/ public/ tmp/ var/
bounce/ defer/ dev/ extern/ hold/ lib64/ pid/ private/ saved/ trace/
#

In connection with qshape it can be used to find out if your server is having performance issues:
  • a large deferred queue indicates delivery problems
  • a large active queue points to slow destinations (e.g. a content_filter)
You can download queuegraph here.

Before you download it, pls check the requirements:
  • rrdtools (Mandriva users: urpmi rrdtool)
  • librrds-perl (Mandriva users: urpmi perl-rrdtool)
After finish downloading it, extract it: tar xzvf queuegraph.tar.gz
List down the extracted files: ls -l (see below)

# ls
queuegraph.cgi* queuegraph-rrd.sh* README
#

Create a cronjob that runs queuegraph-rrd.sh every minute -- this populates the *.rrd database:

* * * * * /usr/local/bin/queuegraph-rrd.sh

Note: On Mandriva, i created a dir under /etc named cron.minutes and copied file queuegraph-rrd.sh into it: cp queuegraph-rrd.sh /etc/cron/minutes

And then I edited crontab by adding this line:
* * * * * root nice -19 run-parts --report /etc/cron.minutes

Then I copied queuegraph.cgi into the cgi-bin directory of my webserver: cp queuegraph.cgi /var/www/cgi-bin/ or where your webserver's cgi directory is (consult your distro manual.) Then chmoded it to 755 so that my webserver can run it: chmod 755 queuegraph.cgi

To see the statistics created by queuegraph, point your web browser to http://yourwebseraddress/cgi-bin/queuegraph.cgi

This is the graph for my postfix queue (without the Month and Year graph):


That's all there is to it.

Second monitor no display after latest update - KDE-neon

 After latest update as of Oct 3, 2023, my second monitor was undetected with latest kernel (6.2.0-33-generic). If I boot with previous kern...